Simulations and Performance Evaluation
("Wireless Networking Fundamentals" starting 2022)
This course deals with several aspects of one fundamental technology we use every day: wireless networks. The course is made of two parts, that are interwined to provide to the student the fundamentals of how wireless networks work. At the end of the course the students will be able to understand the way wireless networks work, simulate these networks and analyse the results of the simulations.
1 - Wireless communications:
The physics of wireless communications are complex, but can be simplified to the bone to provide a robust understanding of how a wireless device works. We will explain what an electromagnetic wave is, how signals are encoded and decoded, how signals propagate in space. Some typical applications of this knowledge are:
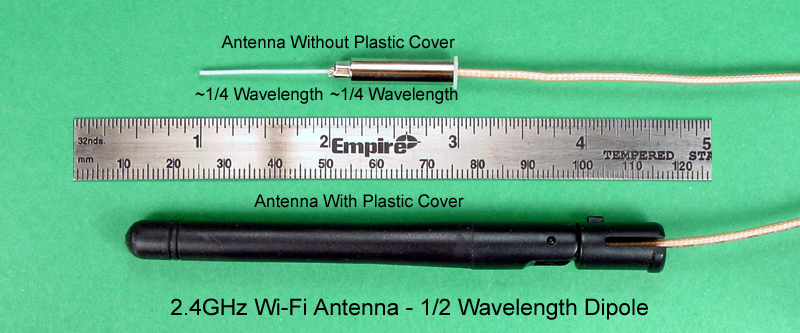
This is a typical dipole antenna that your laptop uses. Do you know why it has that shape? do you know what happens if you replace it with a larger one? Do you know the difference between using a frequency or another in a Wireless network? We will introduce these concepts (image from all about circuits )
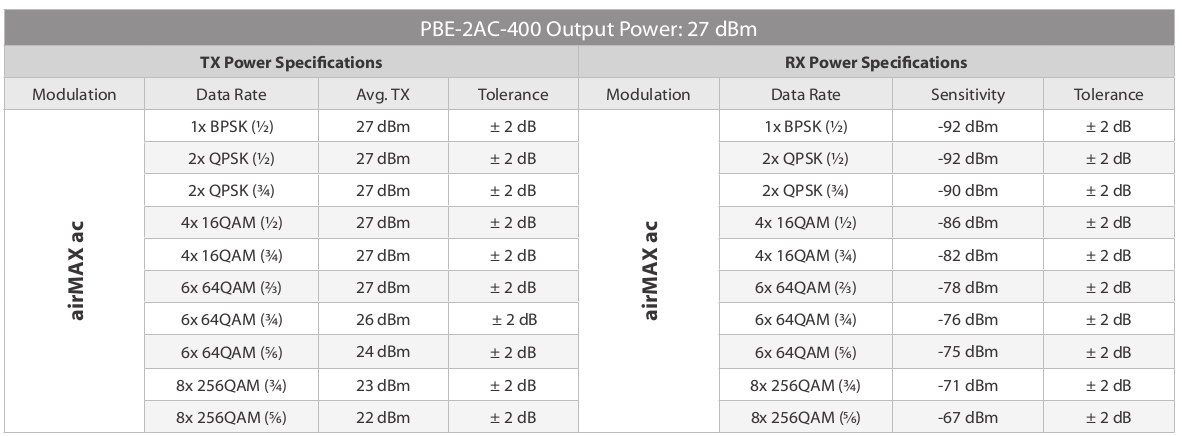
This is the datasheet of a Wi-Fi professional-grade device. Can you read it? Can you understand what are the highest performance the device can have? Under what conditions? You will become familiar with dBs, propoagation and link capacity.
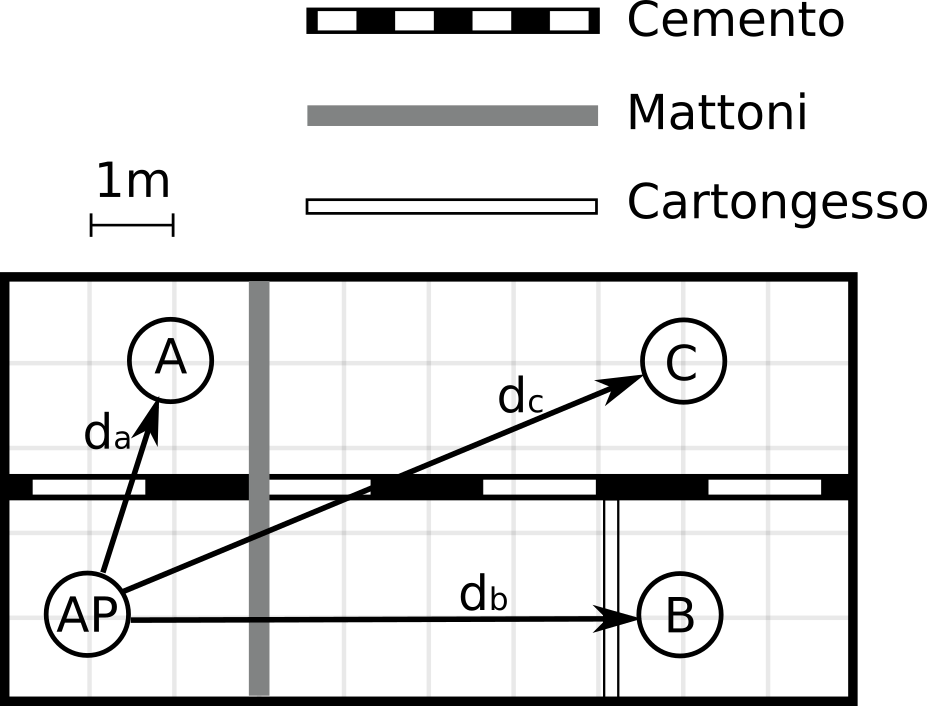
This is an indoor map with walls of different material. Given the transmission power of the AP can you estimate if node C will be able to access the Wi-Fi network? We will introduce the most common models for signal propagation.
2 - Performance Evaluation:
We will soon realize that modelling precisely a wireless communication is impossible. How should we then estimate the performance of a wireless network (or any other system)? One answer is via the repetition of simulation and data analysis.
The omnetpp simulator enables you to simulate wireless networks. In the animation one wireless laptop is moving away from an access point, in the lower image you can see an histogram with the signal intensity of the packets received by the laptop during the simulation (initially very high, then reducing while the laptop moves). The most important concepts introduced in the course will be reproduced in the Omnetpp simulator.
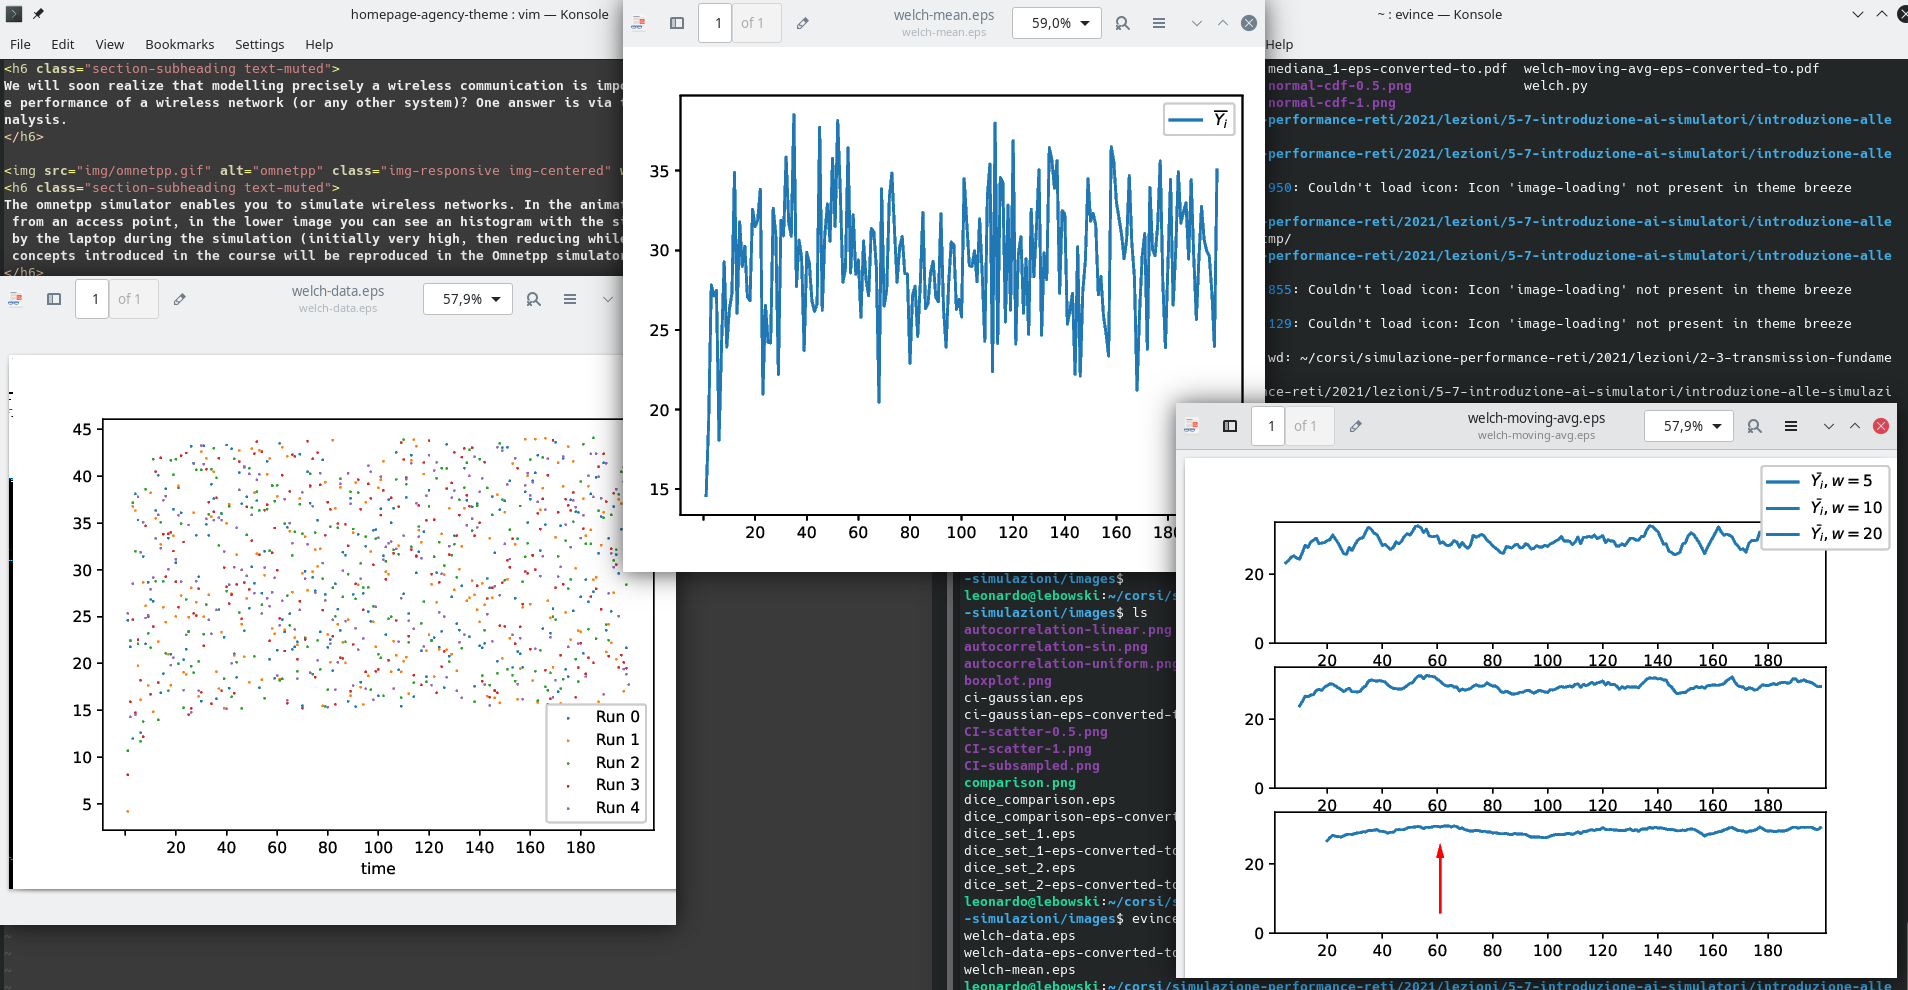
Typically, simulations will produce a cloud of hard to interpret points (left image), which need to be aggregated (middle image) and smoothed (right image) in order to filter out the transitory phases of your simulations. We will learn how to do that.
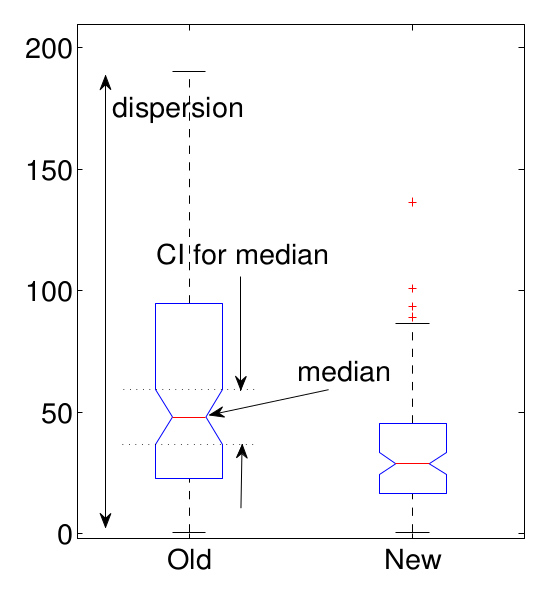
Can you read this graph? do you know what is a confidence interval and how to compute it? what are the key indicators to state if an experiment performs better than another? We will learn how to make an adequate amount of simulations and interpret the results.